V.Y. Kirichenko, O.A. Chernyagina
 Kamchatka Branch of Pacific
Abstract:
A shift in natural resource use priorities is creating genuine
threats to those sectors of the
Kamchatskaya Oblast and the
Koryakskii Autonomous
Okrug economy that are based on the use
of renewable resources. This
article presents the results of the authors' initial analysis of a
map developed to show total anthropogenic impact on natural
systems. The results
obtained to date speak to the need to reexamine existing notions
about the status of natural systems on the peninsula and in adjacent
territories, and they also point to the urgent need to revise
environmental statutes regulating anthropogenic impacts in river
watersheds.
Kamchatskaya
Oblast and the Koryakskii Autonomous
Okrug are territories with a high volume
of wilderness, one of the few unspoiled areas left on our planet. The
region's wilderness status is not only a result of being at great
distance from Russia's industrial centers but is also a consequence of
the region's traditional economic orientation of using renewable
resources and of maintaining a well developed network of protected
territories. With the onset of the third millennium, a noticeable
intensification of natural resource use is observed that is being
accompanied by a shift in natural resource development priorities. The
area directly and indirectly affected by non-renewable resource
extraction is expanding along with the infrastructures built to
service those sectors: roads, gas pipelines, power lines. This is
resulting in a degradation of natural systems and is reducing total
wilderness area. There is a formal recognition of the need to conserve
biodiversity and the conditions necessary for renewable biologic
resources because these renewable resources are the basis for the
Kamchatskaya Oblast and
Koryakskii Autonomous
Okrug economies.
Economic assessment and forecasting are not part of the planning
process for land based mineral resource development facilities, for
oil and gas deposits in salmon rivers and on the shelf of western
This article presents the initial results of an analysis of a map of
total anthropogenic impact on the natural ecosystems of
Table 1.
Direct Threats to
|
Threat Category |
Threat Type |
Mapping |
Data Access and their Availability |
||
|
|
Importance |
||||
|
Habitat Conversion & Degradation
|
•
Housing & Urban Development
•
Industrial Development
•
Commercial Development
•
Farms & Plantations
•
Forestry
•
Natural System Modifications
•
Recreation Areas
•
Military Activities
•
Altered Fire Regime |
Very Good |
Very Important |
Very Good |
+ |
|
Good |
Average |
+ |
|||
|
Low |
± |
||||
|
Very Good |
Good |
- |
|||
|
Transportation Infrastructure |
•
Utility Lines
•
Energy Lines
•
Communication Lines
•
Roads
•
River Shipping Lanes
•
Flight Paths |
Very Good |
Very Important |
Very Good |
+ |
|
Good |
+ |
||||
|
Good |
Low |
± |
|||
|
Energy & Mining |
•
Mining
•
Oil & Gas Drilling
•
Renewable Energy
•
Water Diversion |
Good |
Important |
Good |
± |
|
Biological Resource Harvesting |
•
Logging
•
Fishing
•
Grazing and Ranching
•
Hunting
•
|
Good |
Very Important |
Хорошая |
+ |
|
Average |
Average |
- |
|||
|
Good |
Good |
- |
|||
|
Average |
Average |
- |
|||
|
Recreation & Work in Natural Habitats |
•
Motor-Powered Recreation & Work
•
All Forms of Tourism
•
Scientific Research
•
Military Training
|
Average |
Low Importance |
Average |
± |
|
Pollution |
•
Solid Waste
•
Nutrient Loads
•
Toxics
•
Noise
•
Thermal
•
Light
•
Radioactive Materials |
Average |
Important |
Important |
- |
|
Average |
- |
||||
|
Low |
Good |
- |
|||
|
Average |
|||||
|
Very Good |
|||||
|
Low |
Low Importance |
Low |
- |
||
|
Invasive & Other Problematic Species & Genes |
•
Vegetation
•
Animals
•
Illness
& Pathogenic
Organisms |
Low |
Important |
Average |
- |
|
Low Importance |
Low |
- |
|||
|
Change in Natural Processes |
•
Climate Change
•
Grazing Patterns
•
Fire Regimes
|
Low |
Important |
Low |
- |
|
Average |
Very Important |
Average |
- |
||
The uneven study of the influence of various impact types and the
absence of a uniform classification system and methodology transforms
an integrated analysis of anthropogenic impacts and threats into a
complex, multilevel task. We
have attempted to solve this problem by calculating the impact area
for each threat type, without accounting for specific impacts on
natural environment components. Our attention, in working on this
task, was focused on the direct impact of human infrastructures and
populations and whose range of impacts has an immediate influence on
flora and fauna. Base line materials are combined into 22 layers of
data that have been ordered in significance of impact (Table 2).
Table 2.
Base Line Data Layers Used for Calculations
|
Spot Locations |
Spatial Locations |
||
|
1.
|
Licensed Mineral Deposits |
11. |
Agricultural Lands |
|
2.
|
Helicopter Landing Pads |
12. |
Coniferous Timber Harvest |
|
3.
|
Recreation Sites |
13. |
Cities, Villages greater than 1000 People |
|
Linear Locations |
14. |
Villages from 100-1000 People |
|
|
4.
|
Road Network (Category 4) |
15. |
Villages from 50-100 People, Dachas, Resorts |
|
5.
|
Road Network (Category 5) |
16. |
Villages from 20-50 People, Geologic Prospecting Parties |
|
6.
|
Energy Networks |
17. |
Villages with less than 20 People, Abandoned Villages |
|
7.
|
Communication Networks |
18. |
Airports (Class 5) |
|
8.
|
Gas Pipeline Right of Way |
19. |
Airports (Unclassified) |
|
9.
|
Coastal Shore Zones |
20. |
River Shipping Lanes |
|
10. |
Recreational River Rafting |
21. |
Ministry of Defense Sites |
|
|
22. |
Mineral Mining |
|
Following a summary and analysis of data on anthropogenic impact
zones contained in normative documents, of expert opinions, and of
specific methodological manuals [5-14], the types of threats
identified were correlated with specific
impact dispersal models. The results of these summaries are presented
in Tables 3 and 4. Supplemented by additional materials at our disposal, these summaries
are the basis for a compilation of characteristics for those zones
that have an impact on natural systems (Table 5).
Table 3
Distribution Models for the Influence of Anthropogenic Impacts
(Transgressions)
|
Distribution
Radius, km |
Critical Impact |
Strong Impact |
Significant Impact |
Moderate Impact |
Low Impact |
|
Model
No. |
|||||
|
Model
No. 1 |
0,03 |
0,1 |
0,4 |
1 |
2 |
|
Model
No. 2 |
0,05 |
0,3 |
0,7 |
1,5 |
4 |
|
Model
No. 3 |
0,15 |
1 |
2 |
3,5 |
8 |
|
Model
No. 4 |
0,3 |
1,5 |
3 |
5 |
12 |
|
Model
No. 5 |
0,5 |
2 |
4 |
7 |
16 |
|
Model
No. 6 |
1 |
5 |
10 |
25 |
50 |
Table 4
Division of Source Data According to Impact Model Types
|
Model No |
Source of Impact |
|
Model No. 1 |
•
Helicopter Landing Pads
•
Recreation Sites
•
Recreational River Rafting
•
Coastal Shore Zones
•
Coniferous Timber Harvest
•
Villages with less than 20 People, Abandoned Villages
•
Ministry of Defense Sites* |
|
Model
No. 2 |
•
Energy Networks
•
Communication Networks
•
Gas Pipeline Right of Way
•
Agricultural Lands
•
Villages with 20-50 People, Geologic Prospecting
Parties |
|
Model
No. 3 |
•
Road Network (Category 5)
•
Villages with 50-100 People, Dachas, Resorts
•
River Shipping Lanes |
|
Model
No. 4 |
•
Licensed mines
•
Villages with 100-1000 People
•
Airports (Unclassified)
•
Mineral Mining |
|
Model
No. 5 |
•
Road Network (Category 4)
•
Cities, Villages greate than
1000 People |
|
Model
No. 6 |
•
Airports (Class 5) |
*Given an absence of reliable data on the degree of impact on natural
systems, only moderate and low impact zones are evaluated.
Table 5
Total Impact of Various Models for the Distribution of Impact of
Anthropogenic Transgression on Natural Systems
|
Impact Type |
Distribution Radius, km |
Mammals |
Birds |
|||||||||
|
Model
No
1 |
Model
No
2
|
Model
No
3 |
Model
No
4 |
Model
No
5 |
Model
No
6 |
Reduction in Numbers,
% |
Reduction in Productivity,
% |
Habitat Quality
Reduction
Coefficient
|
Reduction in Numbers,
% |
Reduction in Productivity,
% |
Habitat Quality
Reduction
Coefficient
|
|
|
Catastrophic |
In Actual Area |
100 |
100 |
0 |
100 |
100 |
0 |
|||||
|
Critical |
0.03 |
0.05 |
0.15 |
0.3 |
0.5 |
1.0 |
90-100 |
90-100 |
0-0.1 |
90 |
90 |
0.1 |
|
Strong |
0.1 |
0.3 |
1.0 |
1.5 |
2.0 |
5.0 |
70-80 |
70-80 |
0.2-0.3 |
80 |
80 |
0.2 |
|
Significant |
0.4 |
0.7 |
2.0 |
3.0 |
4.0 |
10 |
50-60 |
50 |
0.4-0.5 |
50 |
50 |
0.5 |
|
Moderate |
1.0 |
1.5 |
3.5 |
5.0 |
7.0 |
25 |
30-40 |
40-50 |
0.6-0.7 |
30 |
30 |
0.7 |
|
Weak |
2.0 |
4.0 |
8.0 |
12 |
16 |
50 |
10-15 |
40-50 |
0.85-0.9 |
10 |
10 |
0.9 |
|
Insignificant |
По расчетному остатку площади |
0-10 |
0-40 |
0.1-1 |
0-10 |
0-10 |
0.1-1 |
|||||
*For this model an experimental assessment of impact on mammals and
birds is not carried out.
A standard calculation methodology is applied to the
ArcGIS module "Modeling" to
estimate "buffer zones." First a map was designed to
establish "buffer zones" for spot, linear and spatial sites
identified as the most pernicious sources of impact (Table 2). Then,
using a map modeling methodology, layers were combined and what was
obtained was an "Integrated Map of Anthropogenic Impact on the
Natural Complexes of Kamchatka." An interim, first order
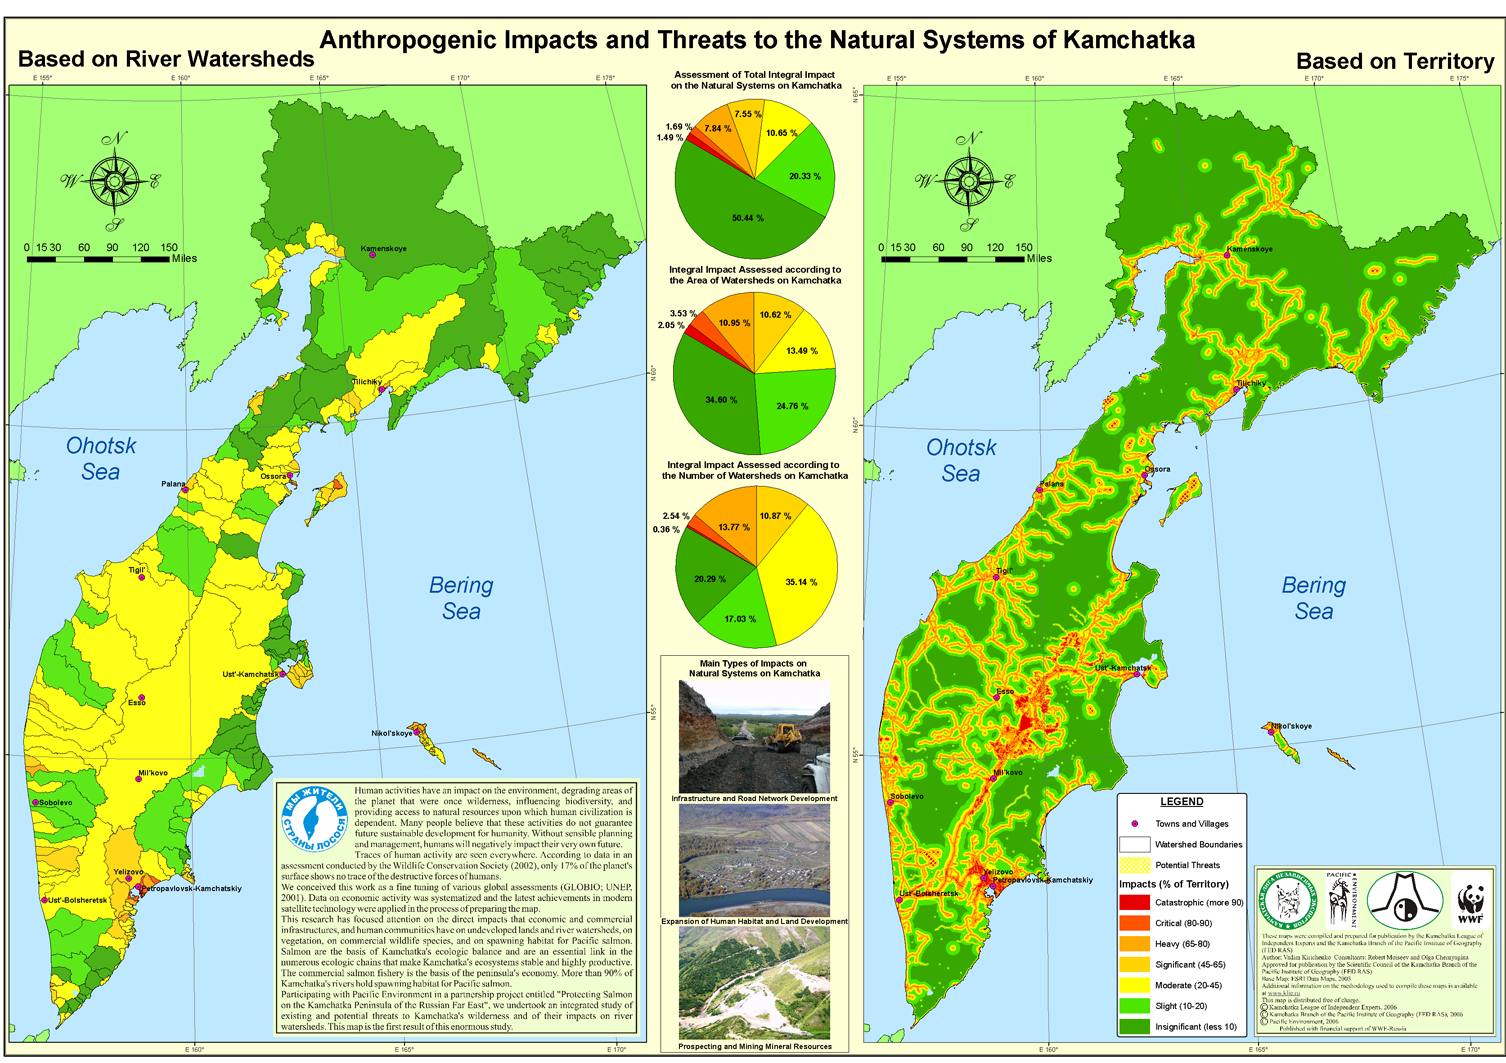
watershed map was prepared to illustrate total anthropogenic impact on
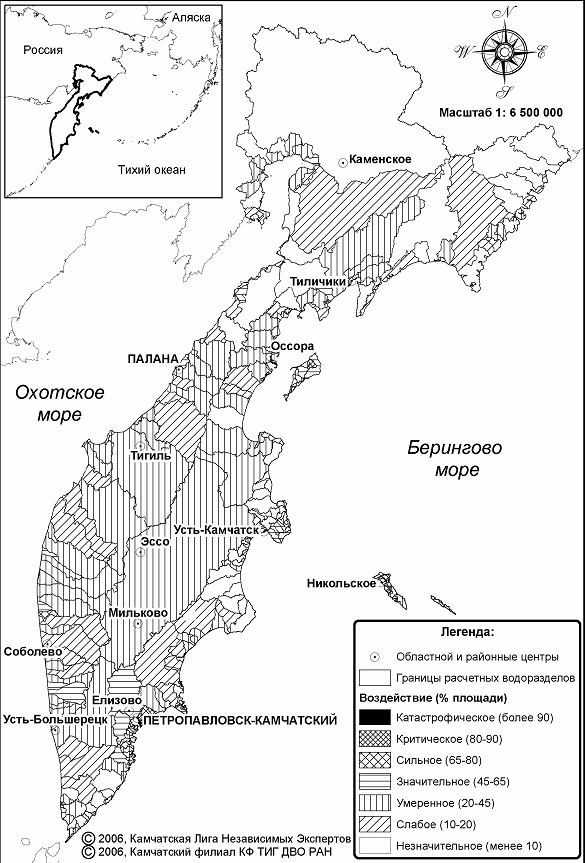
Figure 1.
Anthropogenic Impacts and Threats to Natural Systems Calculated for
the River Watersheds of
The maps produced make it possible to assess the impact of existing
and potential threats to natural systems for the territory and the
level of impact on river watersheds (Figure 2).
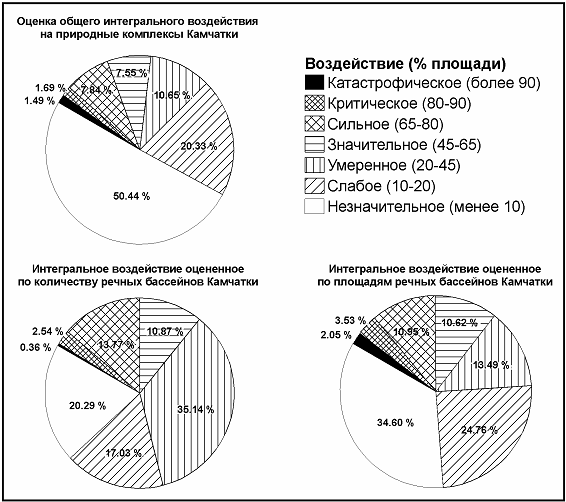
Figure 2.
Assessments of River Watershed Condition for
The results obtained from this first attempt to assess territorial
impact demonstrate the need to reexamine existing notions of the
condition of natural systems on the
Literature
1. Mitenko, G. V., V. V.
Snakin, A. A.
Prisyazhnaya, V. R.
Khisanov, V. O.
Yurin. 2006. A Total Anthropogenic Impact
Map for Ecosystems of the Federal Provinces of the
2. State Report on Environmental Conditions in
Kamchatskaya Oblast and
Koryakskii Autonomous
Okrug in 2003. 2004.
Petropavlovsk-Kamchatskii: Department of
Natural Resources and Environmental Protection, Ministry of Natural
Resources, Kamchatskaya Oblast and
Koryakskii Autonomous
Okrug Branch.
206 p.
3. Salafsky, N., D.
Salzer, J. Ervin, T. Boucher, and W.
Ostlie. 2003. Conventions for Defining, Naming, Measuring, Combining, and
Mapping Threats in Conservation:
An Initial Proposal for a Standard System. Draft Working
Paper. (www.conservationmeasures.org).
4. Proposed Taxonomy of Direct Threats 2005. (www.fosonline.org/CMP/Tax/
)5. Darenskii, A. A., Yu. M. Dunishenko, V. G. Svets. Methodology for Assessing Loss to Damaged Wildlife Habitat (Based on the Example of Khabarovskii Krai). http://www.biodat.ru/chm/impact/imp-6.zip
6. Kirillov, A. V. Methodology for
Assessing Injury and for Calculating Loss to Damaged or Destroyed
Wildlife or to their Habitat in the
Yamalo-Nenetskii Autonomous
Okrug.
Approved by Order of the Governor of
Yamolo-Nenetskii
Okrug. www.biodat.ru/chm/impact/imp-2.zip
7. Kuznetsov, V. A., D. F.
Leont'ev.
Zoning for Level of Impact on Hunting Resources in the
8. Ravkin, E. S. Rationale and
Methodology for Assessing the Level of Environmental Loss Caused by
the Destruction and Damage to Wildlife Habitat in
10. SNiP
11. SNiP 2.07.01-89* - Municipal Planning.
Planning and Construction of Municipal and Village
Communities.
12. SNiP 2.05.02-85 - Automobile
Highways
13. SanPiN 3.4.035-95 - Sanitary
Protection of Territories of the
14. ST SEV 4940-84 - Automobile Roads. Accounting for Traffic
Volume
15. Leman, V.
16. Romanchuk, A. V., A.
V.Ulatov. 2005. Violations of
Environmental Law During the Development of
Mineral Resources in the Watershed of the